Compare MAIHDA Metrics Across Levels of a Grouping Variable
Source:R/compare_maihda.R
compare_maihda_groups.RdFits a separate random-intercept MAIHDA model (intercept-only random
effects; any fixed-effect covariates in formula are still used) within
each level of a higher-level grouping variable (for example country, region, or
survey wave) and reports how the variance partition coefficient (VPC/ICC) and
the between-/within-stratum variance components differ across those groups. When
the strata are defined by at least two dimensions it also fits the adjusted model
(the dimensions' additive main effects) within each group and reports the per-group
pcv – the proportional change in between-stratum variance, i.e. the additive
share of that group's intersectional inequality.
Usage
compare_maihda_groups(
  formula,
  data,
  group,
  engine = "lme4",
  family = "gaussian",
  shared_strata = TRUE,
  min_group_n = 30,
  bootstrap = FALSE,
  n_boot = 1000,
  conf_level = 0.95,
  autobin = TRUE,
  decomposition = c("two-model", "crossed-dimensions"),
  sampling_weights = NULL,
  ...
)
Arguments
- formula
A model formula. Either the shorthand intersectional form
outcome ~ covars + (1 | var1:var2)(strata are built automatically) oroutcome ~ covars + (1 | stratum)whendataalready contains astratumcolumn frommake_strata.- data
A data frame containing the variables in
formulaand the grouping variable.- group
Character string naming the grouping variable in
data(e.g."country"). A separate model is fitted for each non-missing level.- engine
Modeling engine, "lme4" (default), "brms", "wemix" (the design-weighted fit; requires
sampling_weightsand is selected automatically when they are supplied with the default engine), or "ordinal" (cumulative link mixed model viaordinal::clmm(); selected automatically for an ordinal family or an ordered-factor outcome).- family
Model family. Default "gaussian". As in
fit_maihda, a binary outcome is auto-detected once on the full data and switched to "binomial" (with a warning) so every group uses the same family.Logical. When TRUE (default) intersectional strata are defined once on the full data so that a stratum denotes the same combination in every group; this makes the stratum definitions comparable across groups. Note that a group may still not contain every stratum, so two groups' VPCs can be estimated over different sets of populated strata – they are then not strictly directly comparable, and the function warns when this happens. When FALSE, strata are rebuilt independently within each group (stratum identities are then not comparable across groups at all).
- min_group_n
Minimum size of the analytic sample a group must have – the rows that survive the model frame (covariate transformations applied, rows with a missing outcome/covariate dropped) – to be modelled. Groups with a smaller usable sample are skipped with a warning, even if they have more raw rows. Default 30.
- bootstrap
Logical; compute per-group parametric-bootstrap VPC confidence intervals. lme4 engine only. Default FALSE.
- n_boot
Number of bootstrap samples when
bootstrap = TRUE. Default 1000.- conf_level
Confidence level for bootstrap intervals. Default 0.95.
- autobin
Logical passed to
make_stratacontrolling tertile binning of numeric grouping variables. Default TRUE.- decomposition
Per-group additive-vs-interaction decomposition: the two-model null -> adjusted PCV (
"two-model", default) or the single crossed-dimensions model ("crossed-dimensions";"cross-classified"is a deprecated alias that warns). The crossed-dimensions form requiresshared_strata = TRUEand at least two stratum dimensions, and adds thevar_additive,var_interaction,additive_shareandinteraction_sharecolumns (in place ofpcv/var_between_adjusted);var_betweenis then the total between-strata variance (additive + interaction). Seemaihdafor the underlying model and its caveats.- sampling_weights
Optional name of a sampling-weight column in
datafor design-weighted per-group fits; seefit_maihda. The column is sliced with each group's rows, so every group is fitted with its own members' weights. Not compatible withengine = "lme4",bootstrap = TRUE, or (under the wemix engine)decomposition = "crossed-dimensions".- ...
Additional arguments passed to
fit_maihda(and on tolmer/glmer).
Value
A data.frame of class maihda_group_comparison with one
row per group and columns group, n, n_strata,
vpc, var_between, var_other, var_residual,
status (and ci_lower/ci_upper when
bootstrap = TRUE). When the strata are defined by at least two
dimensions, two further columns report the per-group null -> adjusted
decomposition: pcv (proportional change in between-stratum variance when
the dimensions' additive main effects are added; computed on the
maximum-likelihood scale – see calculate_pvc – because REML
variances are not comparable across the null vs. adjusted fixed effects),
var_between_adjusted (a derived coherence quantity, reported as
var_between * (1 - pcv) so it shares the scale of the REML
var_between/vpc and the table satisfies
pcv = (var_between - var_between_adjusted) / var_between exactly – it is
not the adjusted fit's own variance), and
var_between_adjusted_ml (the adjusted model's actual
between-stratum variance, read straight off the adjusted fit on the same
maximum-likelihood scale as the PCV; it differs from var_between_adjusted
only by the small REML-vs-ML gap in the null variance). All three are
NA for a group whose adjusted fit failed, and the columns are
omitted entirely when the strata have a single dimension. n is the analytic sample size used by the
model (after dropping rows with a missing outcome/covariate) for both fitted
and skipped groups, falling back to the raw row count only when the model
frame cannot be built. var_other is the variance of any additional
random effects and is 0 for the canonical single-stratum model. Groups that
were skipped or failed have NA metrics and an explanatory
status.
Details
It estimates one VPC per group as a stratified analysis: each group is modelled independently. It is not a cross-classified model and does not adjust the strata for the grouping variable.
The VPC is the share of the unexplained variance that lies between strata,
not the absolute magnitude of intersectional inequality. Because it is a ratio,
a group's VPC can differ from another's because the between-stratum variance
differs, because the within-stratum (residual) variance differs, or both – two
groups with the same between-stratum variance can have very different VPCs. To
compare the absolute amount of between-stratum (intersectional) variation across
groups, read the returned var_between column alongside the VPC rather than
treating a higher VPC as "more inequality".
It is descriptive: it reports each group's VPC (with an interval when available – an lme4 bootstrap CI or a brms credible interval) for side-by-side comparison, but does not test whether the VPCs differ between groups. The per-group intervals describe each group's own uncertainty; whether two intervals overlap is not a valid test of the difference between their VPCs, which would require modelling that difference directly.
Robustness: a group whose analytic sample (rows surviving the model
frame) has fewer than min_group_n observations is always skipped with a
warning. A group with fewer than two populated strata is also skipped
(VPC is undefined with a single stratum) when the stratum membership is known
before fitting – that is, when shared_strata = TRUE or data
already carries a stratum column. Under shared_strata = FALSE
strata are rebuilt inside each group, so a degenerate single-stratum group is
instead reported with a "fit failed" status rather than a pre-fit skip. A
singular fit yields a VPC of 0 rather than an error (unlike
calculate_pvc). A hard fit failure in one group records NA
and a status note without aborting the whole comparison.
Fit-quality diagnostics: for the lme4 engine, groups whose model is
singular or fails to converge keep a status of "ok" (the fit did
complete) but are named in a single aggregated warning, because their VPC/ICC
may be unreliable – a singular fit usually pins the between-stratum variance at
the boundary, giving a VPC of 0.
See also
compare_maihda for comparing different models on the
same data; plot.maihda_group_comparison for visualising the result.
Examples
# \donttest{
data(maihda_country_data)
# How does gender x SES inequality in PISA math scores differ across countries?
cmp <- compare_maihda_groups(
math ~ 1 + (1 | gender:ses),
data = maihda_country_data,
group = "country"
)
#> boundary (singular) fit: see help('isSingular')
#> boundary (singular) fit: see help('isSingular')
#> boundary (singular) fit: see help('isSingular')
#> boundary (singular) fit: see help('isSingular')
#> boundary (singular) fit: see help('isSingular')
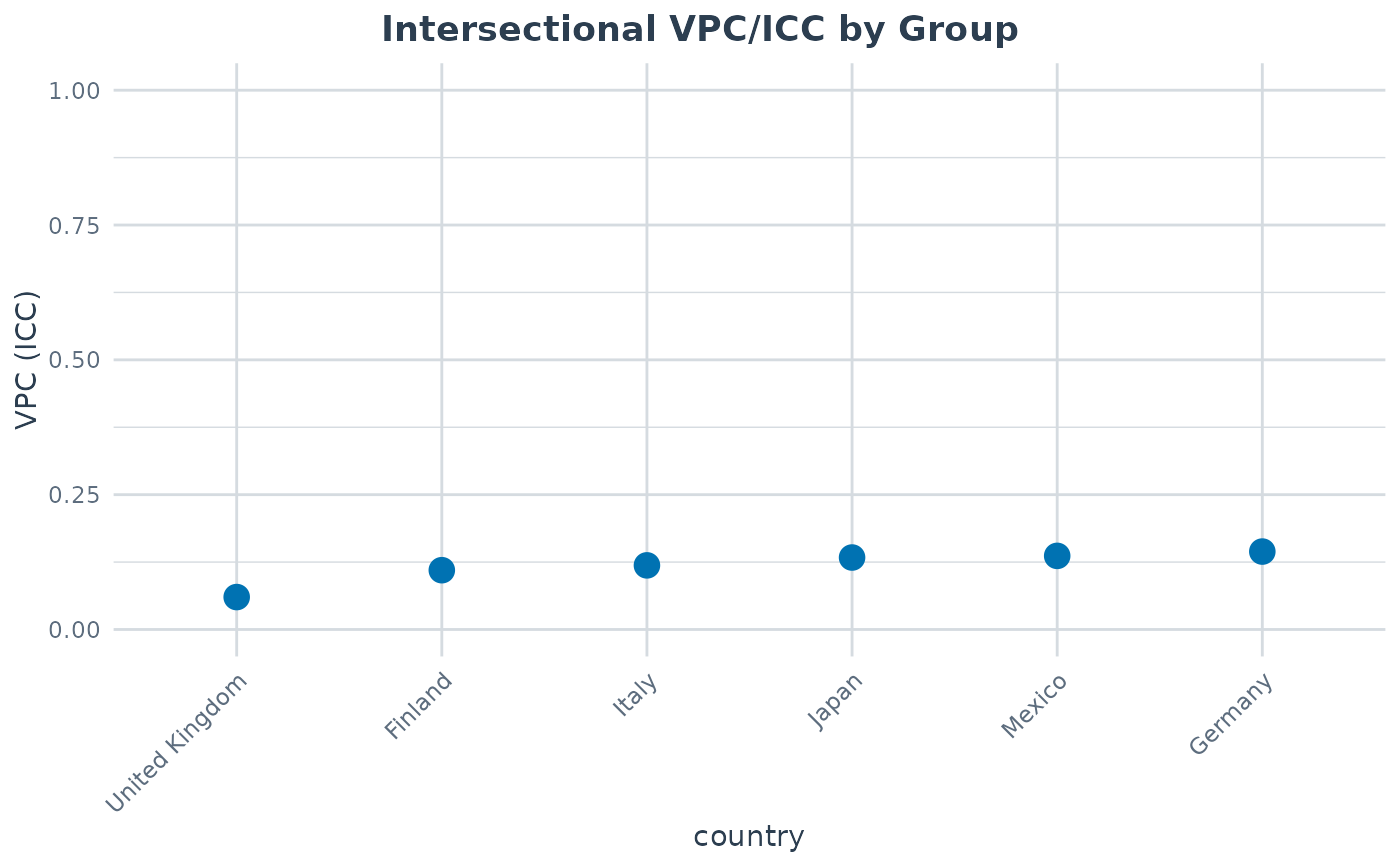
print(cmp)
#> MAIHDA Group Comparison
#> =======================
#>
#> Group variable: country
#> Engine: lme4 | Family: gaussian | Strata: shared/global
#>
#> group n n_strata vpc var_between var_other var_residual pcv
#> Finland 600 6 0.10994 785.8 0 6361 1
#> Germany 600 6 0.14448 1271.6 0 7529 1
#> Italy 600 6 0.11890 1065.3 0 7895 1
#> Japan 600 6 0.13344 1032.3 0 6704 1
#> Mexico 600 6 0.13649 771.5 0 4881 1
#> United Kingdom 600 6 0.06011 470.5 0 7357 1
#> var_between_adjusted var_between_adjusted_ml status
#> 0.000e+00 0.000e+00 ok
#> 0.000e+00 0.000e+00 ok
#> 0.000e+00 0.000e+00 ok
#> 3.782e-12 3.022e-12 ok
#> 0.000e+00 0.000e+00 ok
#> 0.000e+00 0.000e+00 ok
plot(cmp, type = "vpc")
 # }
# }