Interactive Data Analysis with MAIHDA
Hamid Bulut
2026-07-02
Source:vignettes/interactive_app.Rmd
interactive_app.RmdIntroduction
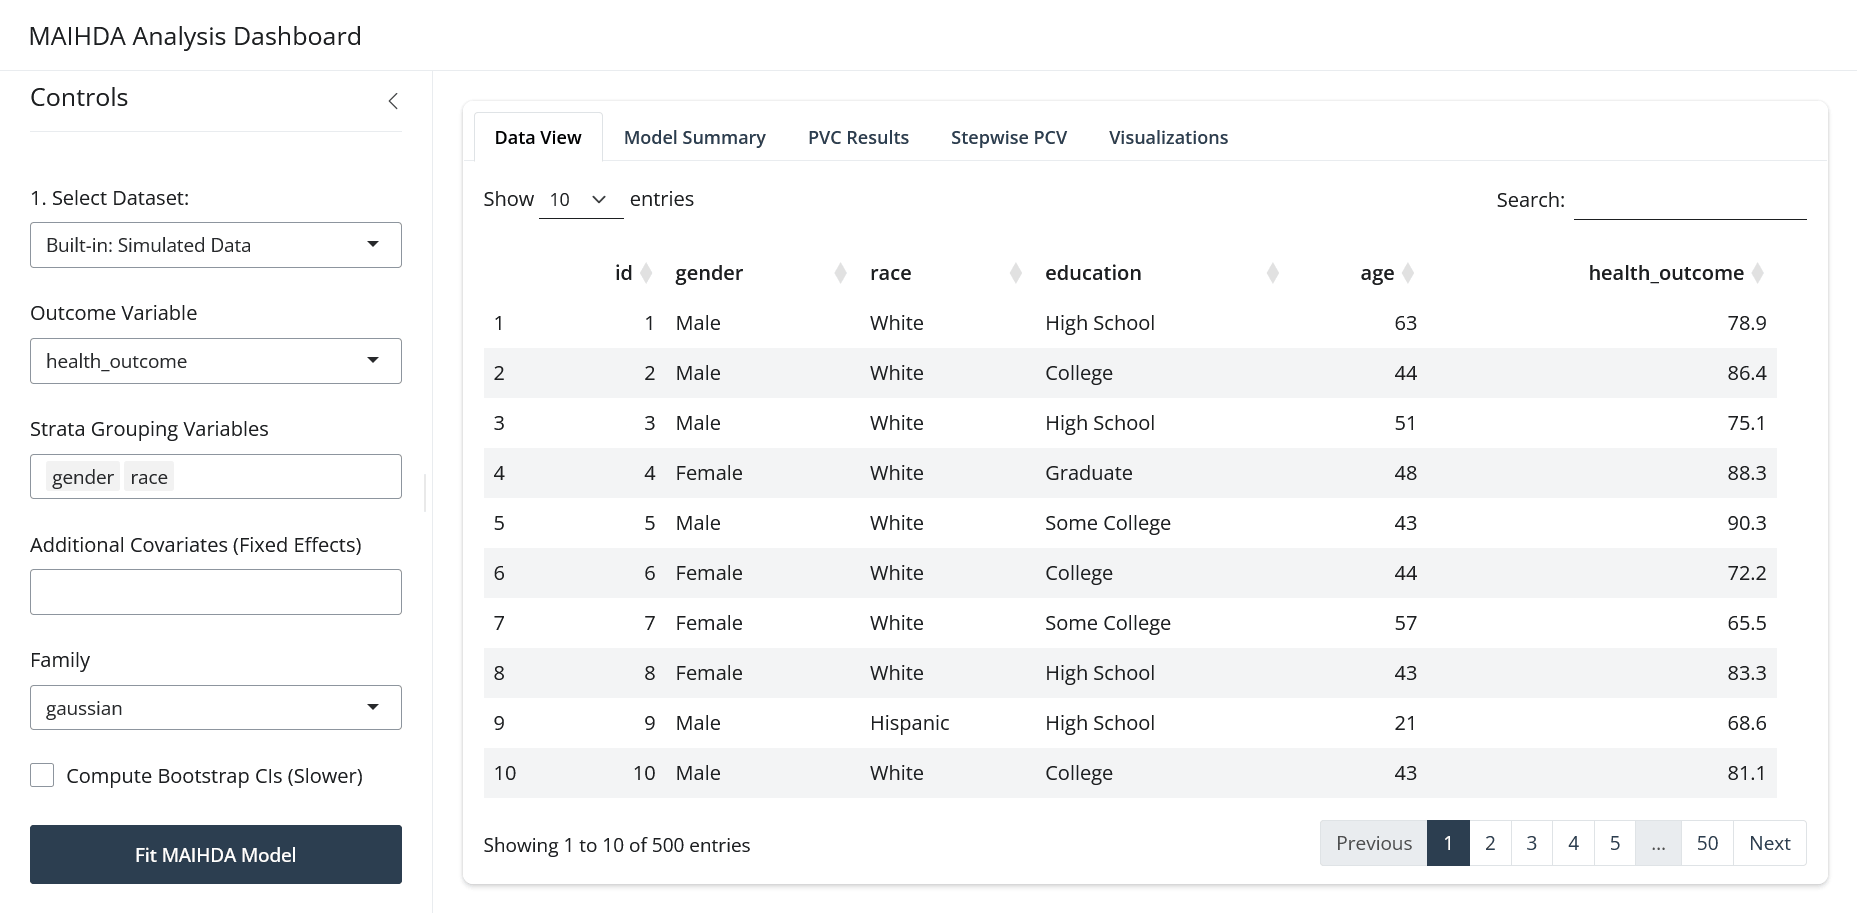
The MAIHDA package includes a fully-featured interactive Shiny Dashboard that provides a no-code alternative to exploring your data, building intersectional strata, fitting models, and analyzing inequality. This is particularly useful for rapid exploration.
Launching the Application
Online Version
You can access a live, cloud-hosted version of the MAIHDA interactive dashboard directly in your browser without installing R: https://hdbt.shinyapps.io/shiny/
App Features
1. Data Import
-
Upload Own Data: Easily upload datasets in
.csv, Stata (.dta), or SPSS (.sav) formats. -
Use Included Data: Try out the app instantly by
selecting the pre-loaded built-in NHANES health data
(
maihda_health_data) or PISA country data (maihda_country_data). - View Data: The app includes an interactive data table letting you sort, filter, and inspect variables before analyzing.
2. Variable Selection & Strata Creation
- Choose a categorical/continuous outcome metric from your dataset.
- Select two or more categorical demographic variables (e.g., gender, race, education) to automatically generate intersectional strata.
3. Model Fitting & Settings
- Fit models with the lme4 engine used by the
interactive dashboard. Bayesian brms models remain
available from R code via
fit_maihda(engine = "brms"). - Select covariates to control for within your models.
- Choose whether to calculate parametric bootstrap confidence intervals to quantify uncertainty. When enabled, the dashboard reports bootstrap intervals for both the Variance Partition Coefficient (VPC / ICC) – shown in the Model Summary and Interactive Explorer tabs – and the Proportional Change in Variance (PCV), shown in the PCV Results tab.
4. Interactive Visualizations
Once a model is fit, you can navigate across multiple tabs:
- Predicted Values: Visually evaluate stratum-level predictions relative to the overall mean with dynamic prediction intervals.
- VPC Decomposition: Examine how much of your outcome’s variance is attributed to between-stratum differences versus within-stratum individual heterogeneity.
- Observed vs. Shrunken Estimates: Compare raw unadjusted group means to your model’s shrinkage estimates to see the protective mechanism of multilevel modeling.
5. Stepwise Variance Analysis (PCV)
The dashboard calculates stepwise Proportional Change in Variance (PCV) tables:
- See the proportional change in between-stratum variance as covariates are added sequentially (a model-dependent, descriptive comparison, not a causal decomposition of inequality).
- Uncover masking/suppression effects directly inside the app by comparing partial PCV values across models.