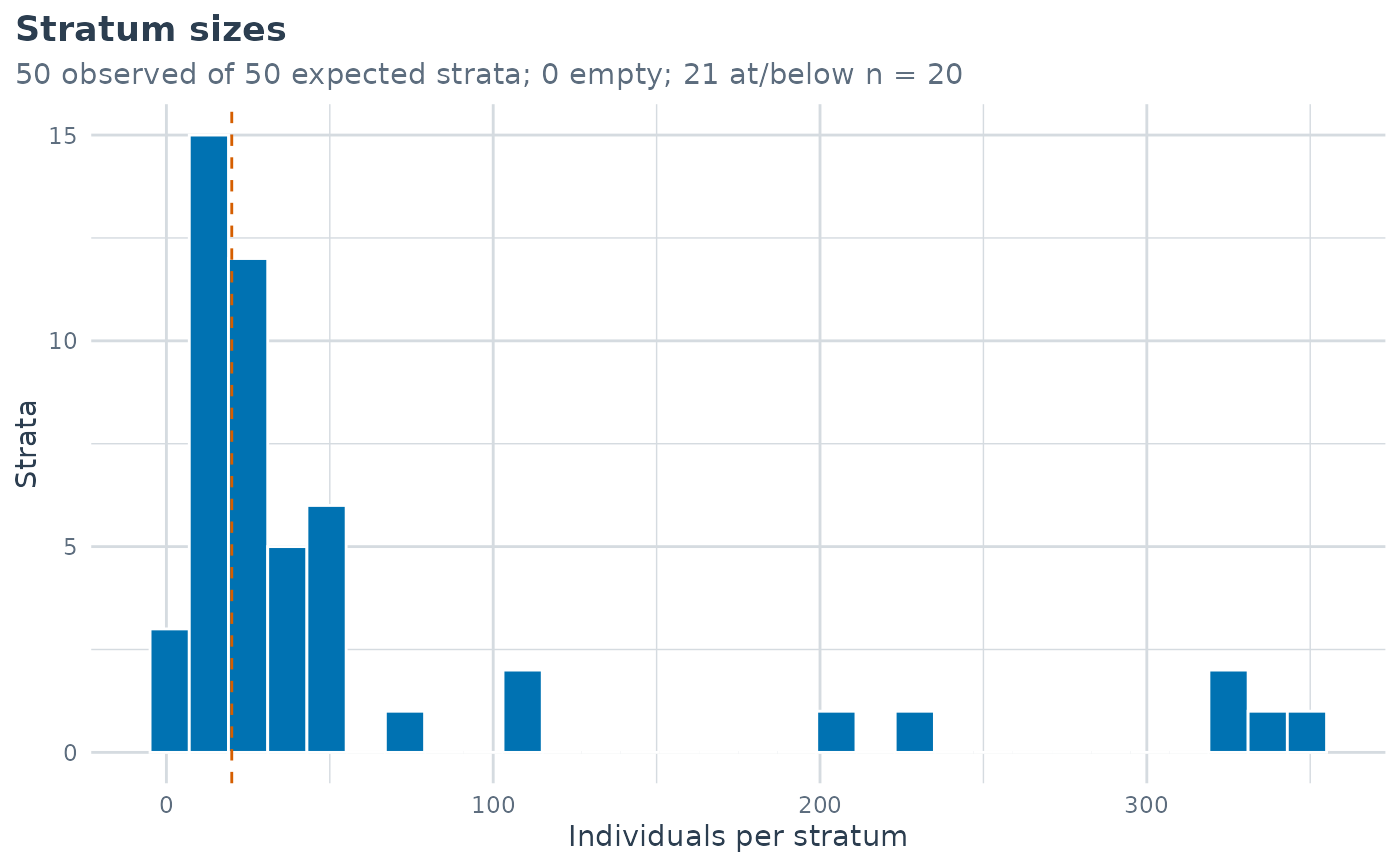
Descriptive plots for a maihda_describe object: the
stratum-size distribution (the sparsity of the strata space), the
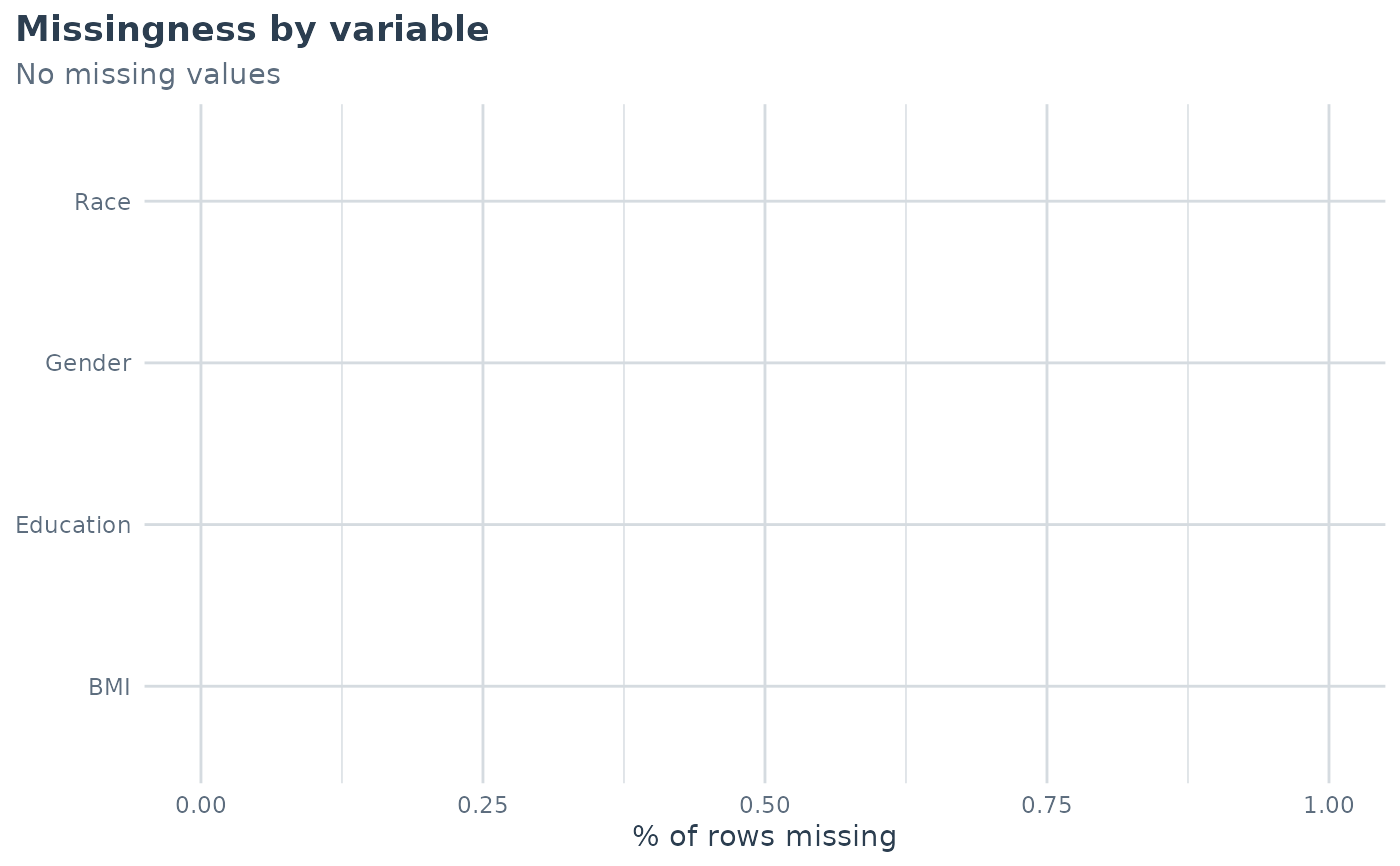
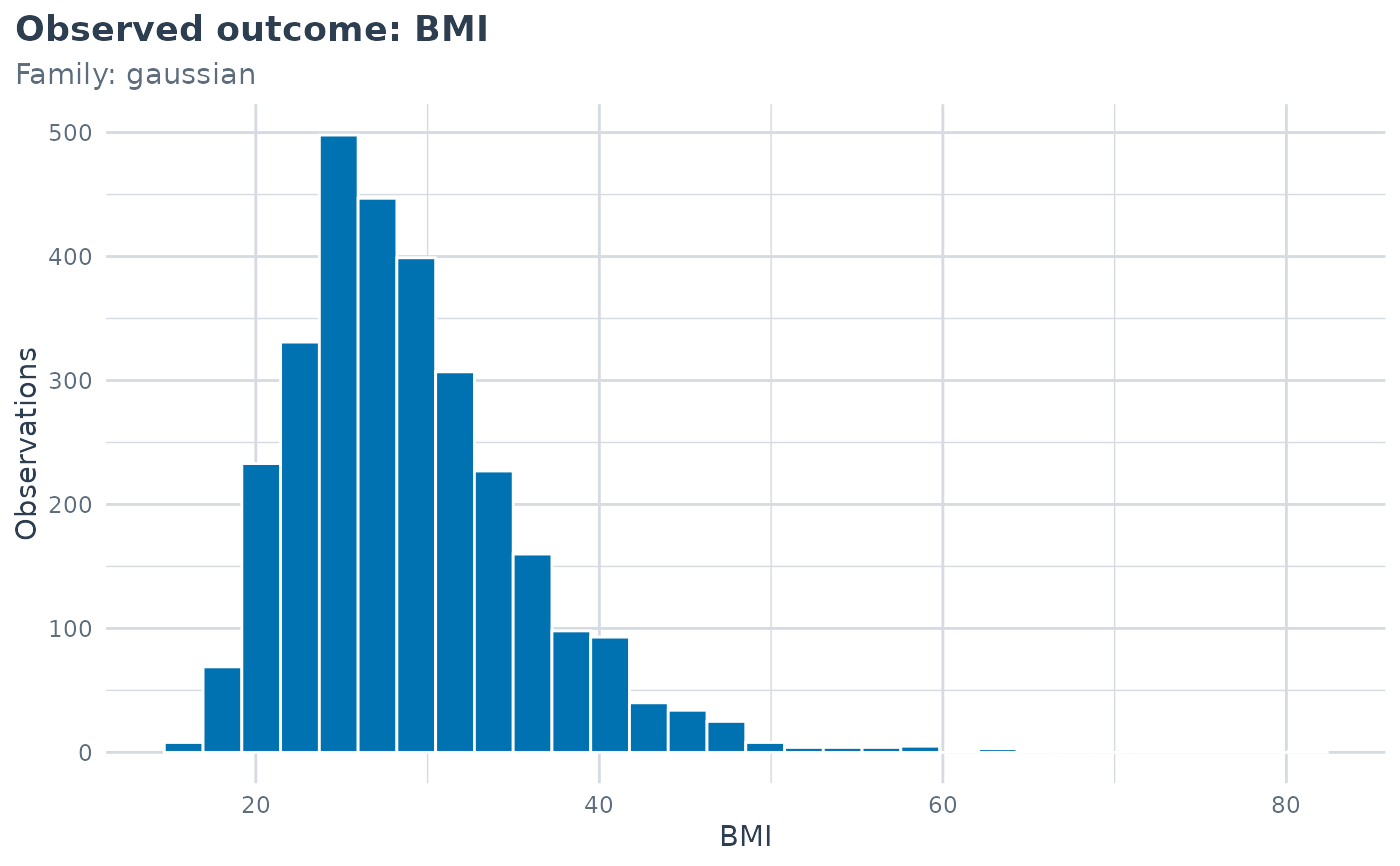
family-aware outcome distribution, and per-variable missingness.
Arguments
- x
A
maihda_describeobject.- type
One of
"stratum_size"(default; histogram of stratum sizes with the small-stratum threshold marked, empty strata included as zeros when they were enumerated),"outcome"(histogram of a continuous/count outcome, or category bars for a binomial/ordinal one), or"missingness"(percent missing per variable).- ...
Additional arguments (not used).
Examples
desc <- maihda_describe(BMI ~ Age + (1 | Gender:Race:Education),
data = maihda_health_data)
plot(desc, type = "stratum_size")
 plot(desc, type = "outcome")
 plot(desc, type = "missingness")