Creates various plots for visualizing MAIHDA model results including caterpillar plots, variance partition coefficient comparisons, observed vs. shrunken estimates, and predicted subgroup values with confidence intervals.
Usage
plot_maihda(
  object,
  type = c("caterpillar", "vpc", "obs_vs_shrunken", "predicted"),
  summary_obj = NULL,
  n_strata = 50,
  ...
)
Arguments
- object
A maihda_model object from
fit_maihda().- type
Character string specifying plot type:
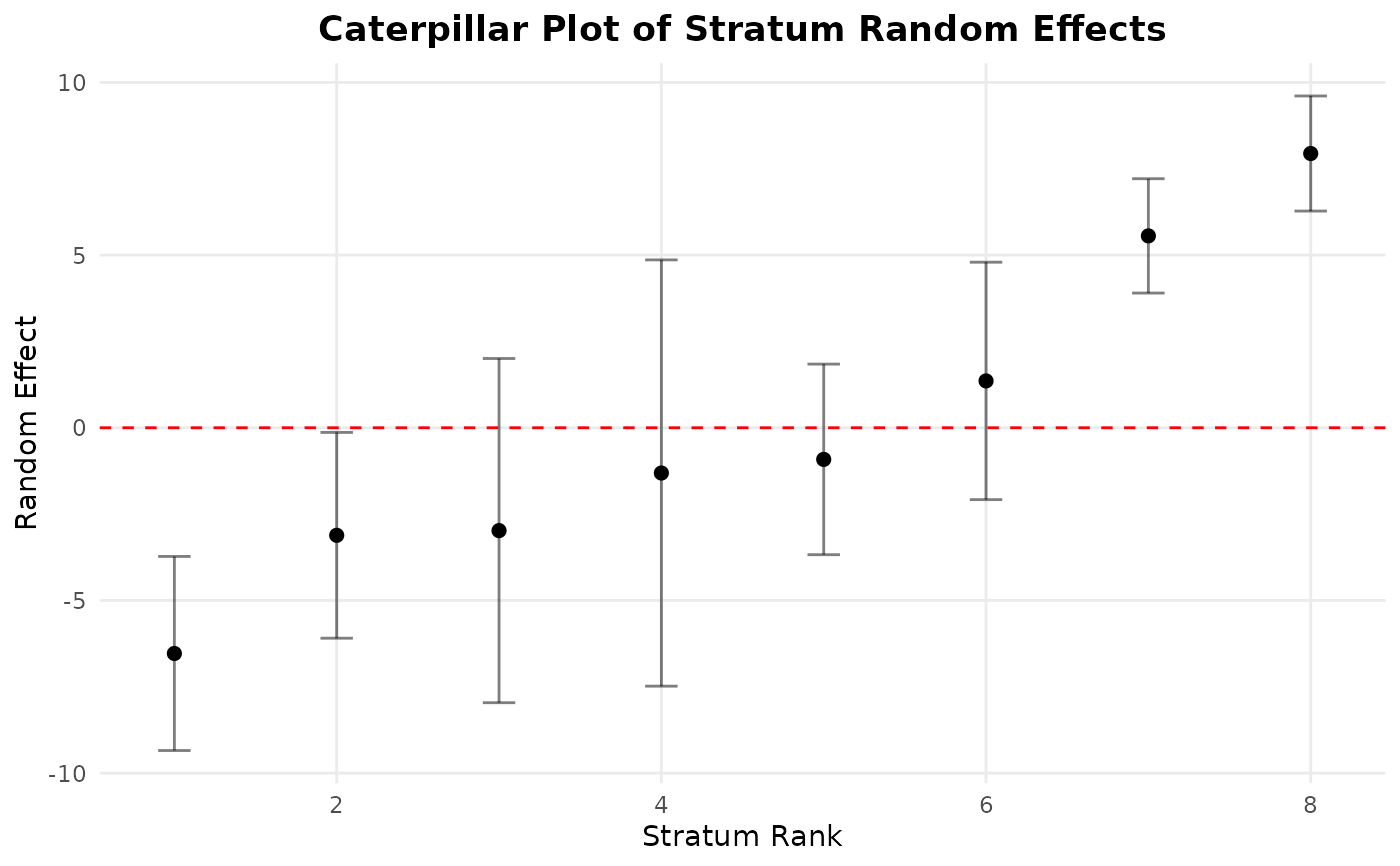
"caterpillar": Caterpillar plot of stratum random effects
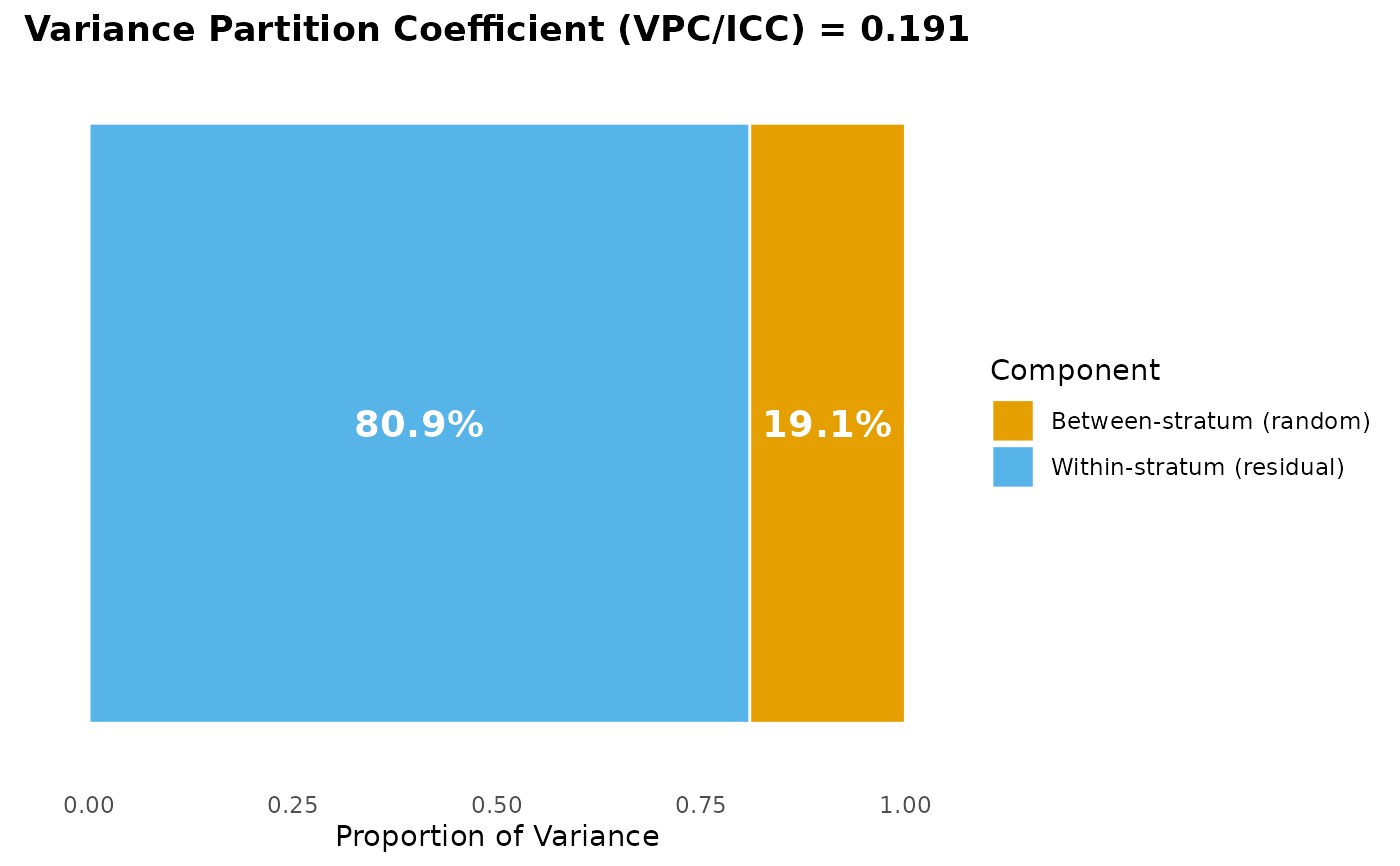
"vpc": Variance partition coefficient visualization
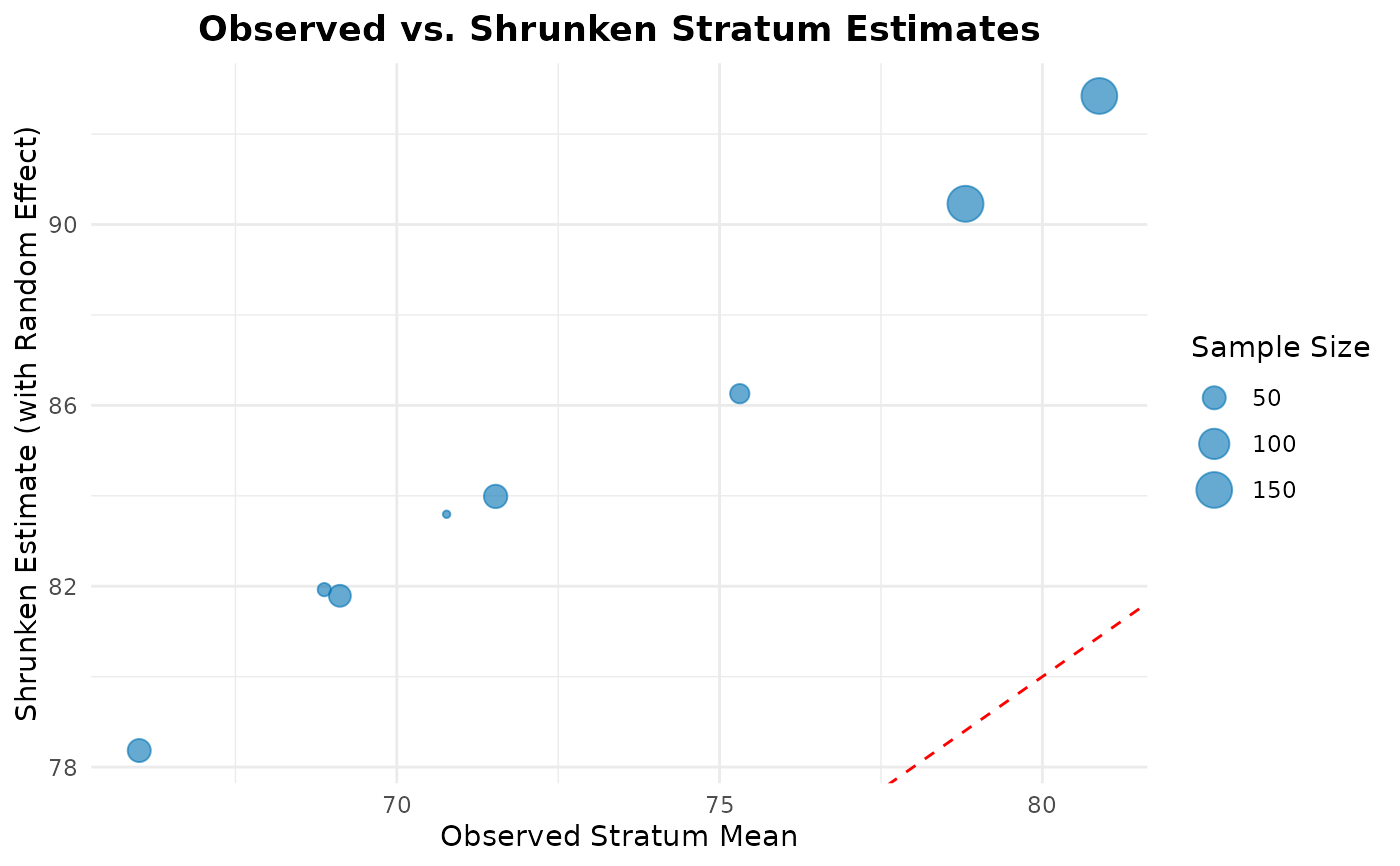
"obs_vs_shrunken": Observed vs. shrunken stratum means
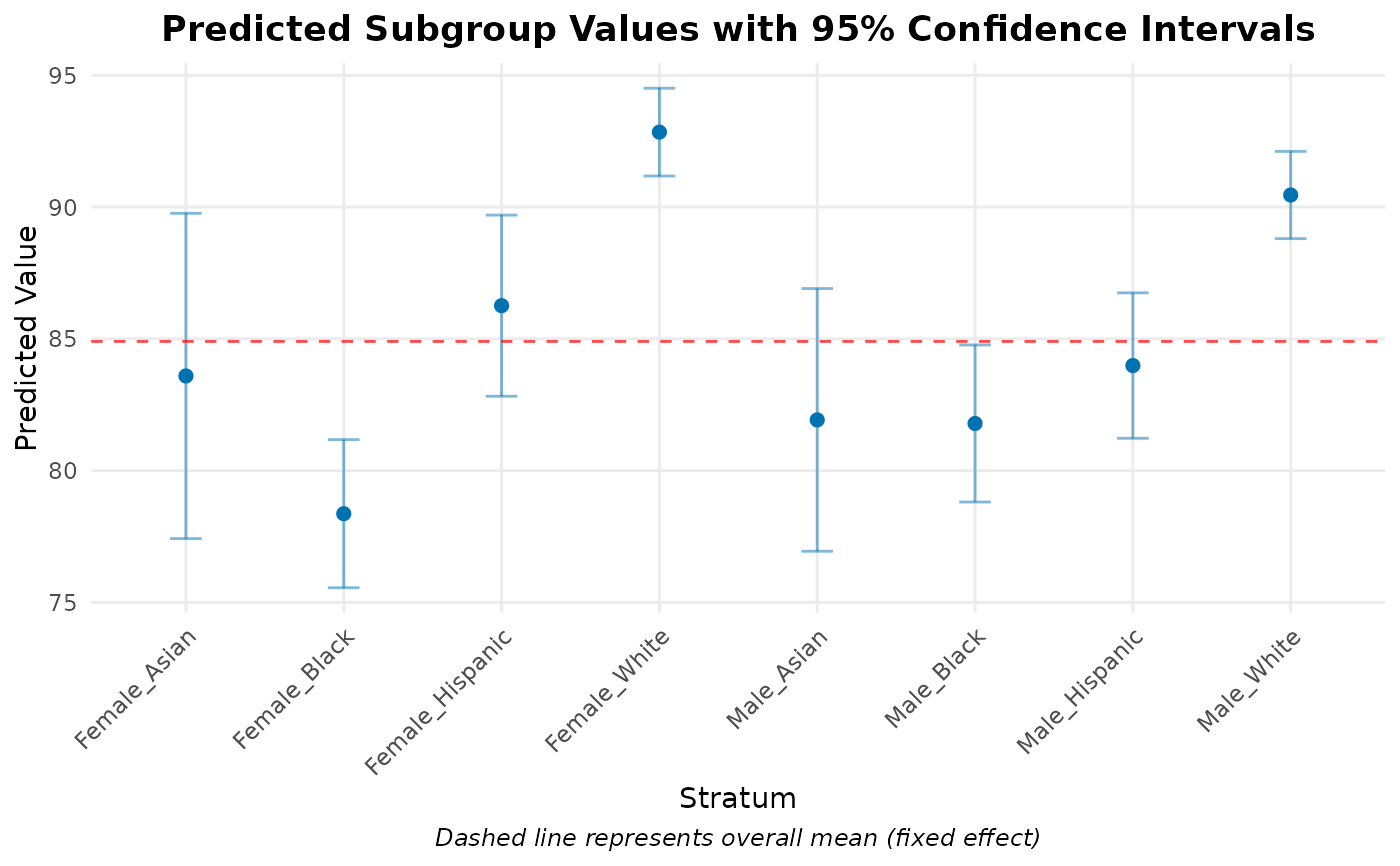
"predicted": Predicted values for each stratum with confidence intervals
- summary_obj
Optional maihda_summary object from
summary_maihda(). If NULL, will be computed.- n_strata
Maximum number of strata to display in caterpillar plot or predicted plot. Default is 50. Use NULL for all strata.
- ...
Additional arguments (not currently used).
Examples
# \donttest{
strata_result <- make_strata(maihda_sim_data, vars = c("gender", "race"))
model <- fit_maihda(health_outcome ~ age + (1 | stratum), data = strata_result$data)
# Caterpillar plot
plot_maihda(model, type = "caterpillar")
 # VPC plot
plot_maihda(model, type = "vpc")
# VPC plot
plot_maihda(model, type = "vpc")
 # Observed vs shrunken plot
plot_maihda(model, type = "obs_vs_shrunken")
# Observed vs shrunken plot
plot_maihda(model, type = "obs_vs_shrunken")
 # Predicted values with confidence intervals
plot_maihda(model, type = "predicted")
# Predicted values with confidence intervals
plot_maihda(model, type = "predicted")
 # }
# }